
Getting Started with Data-Driven Decision Making
March 16, 2022
“Data wins arguments” is a phrase that is frequently thrown around in Silicon Valley. It was originally made famous by Facebook’s then CIO Tim Campos. It perfectly describes the ethos of today’s technology companies like Facebook, Amazon, and Netflix, which religiously use data to guide their business decisions.
When you present a case that is backed by empirical evidence in the form of data, the argument becomes irrefutable and the decisions become easier. Often, decision-makers will turn to intuition, and while that approach has its own merits, it has been proven time and again through the explosive success and growth of technology companies (who tend to be more data-driven), that leaning on data to validate hypotheses and make decisions based on what the numbers suggest, is a winning strategy.
Start by Measuring

One of the things we often hear from executives and decision-makers is that they want to adopt a data-driven approach towards decision making, but don’t know where to begin. This is a common problem and one that has a much simpler solution than you think.
You can start by measuring. It is impossible to make data-driven decisions without having actual data. A lot of businesses that have been established for decades are entrenched in legacy systems and technologies that aren’t agile enough to integrate with data pipelines or analytics engines. This puts today’s decision-makers in a conundrum where they don’t have the complete picture and are being forced to make decisions without all the information.
Collecting data can mean a slew of different things based on the company, which vertical they’re in, what tools they use to operate, etc. Through an exercise called Business Process Modeling, the company can identify all the different workflows and data points for the company and determine which ones they are currently measuring, and which ones need to be measured (ideally, you want to measure as much as possible, so that you can be flexible later). If a company does not have in-house analysts or the resources to perform such an activity, business intelligence advisors and consultants like Smart Answers can help with this activity.
Data Warehouses and Data Pipelines
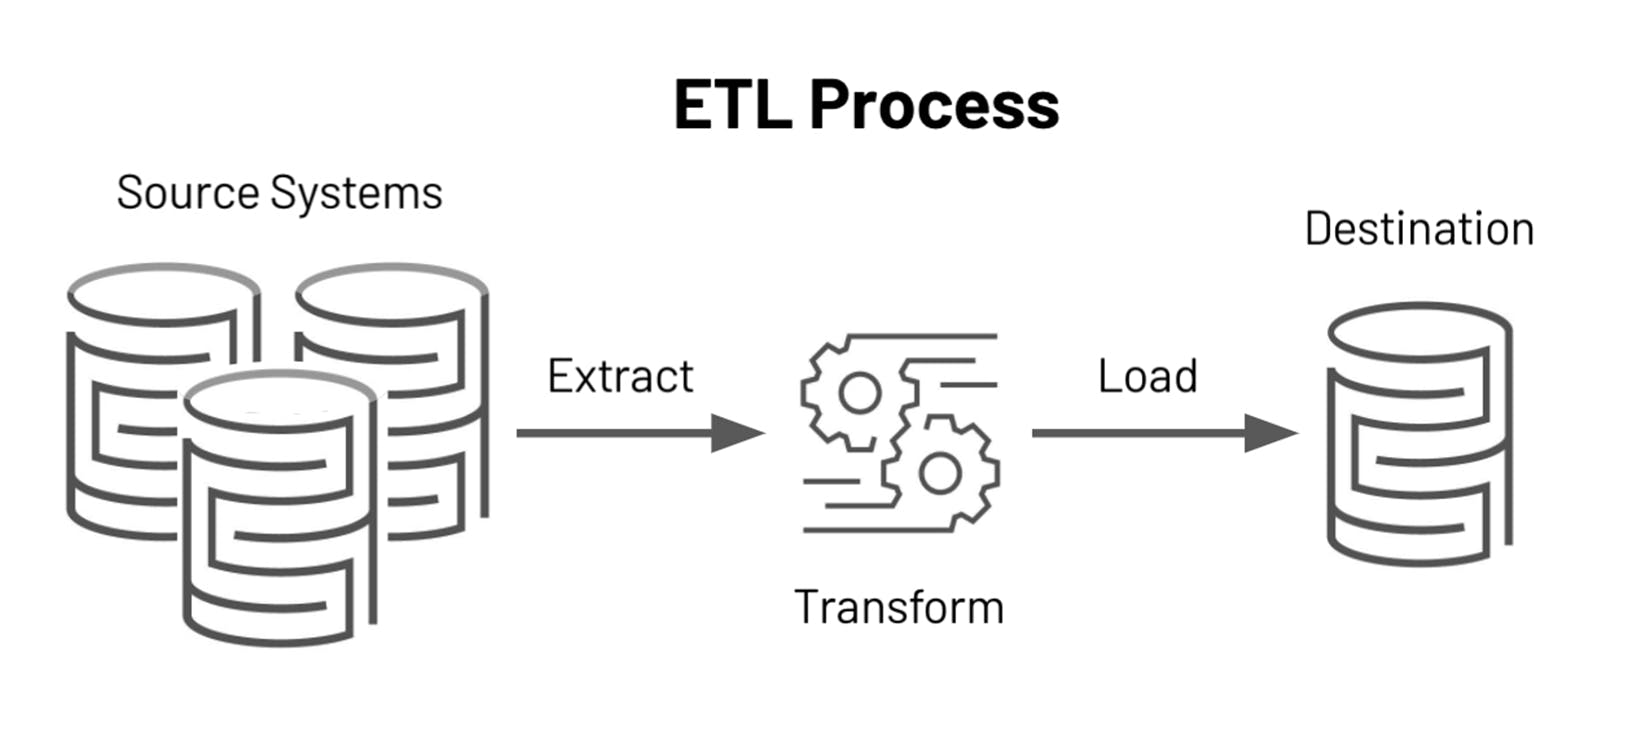
Once you start measuring the different metrics in the business process, you will need a place to store this data and a pipeline to ensure the continuous flow of this data to and from the data warehouse.
Data warehouses are large stores of data that are optimized for running analytics and business intelligence algorithms to create visualizations and dashboards for decision-makers who can leverage this information to validate hypotheses and present the data as empirical evidence in making their case.
These days, spinning up a data warehouse in the cloud is extremely easy with services like Amazon Redshift and Google BigQuery to name just a few.
Once the data is securely stored in a data warehouse, data pipeline tools like Stitch Data or Fivetran can be integrated to ensure that all sources of data are aggregated and stored in the data warehouse in a timely manner. These can be run on a timer or triggered by an event to go through all the data sources and look for newly updated data and bring it into the data warehouse for further analysis.
Business Intelligence Tools

Once you have your data warehouse and data pipeline in place, it’s time to crunch the data and turn it into actionable business intelligence for decision-makers. To do this, you can use tools such as Tableau or Power BI. However, with these tools, you will need an in-house team of technology experts to build dashboards with these tools. And even then, these tools won’t leverage machine learning or AI to deliver any additional information beyond what is present in the data.
This is where business intelligence tools like Smart Answers come in. By leveraging machine learning, Smart Answers delivers predictive analytics and information that the AI can glean from patterns and trends it picks up in the data.
For example, for a mobile/cell service company, a machine learning algorithm can be fed data from the past two years of customer usage trends along with the outcome of whether that customer renewed or canceled their subscription. Based on this information, the machine learning model will be able to connect with the data warehouse and use the existing day-to-day data to identify at-risk customers based on similar patterns and trends found to customers that have canceled in the past. The confidence rating of these predictive models are usually quite high, around ~80%.
Conclusion
Becoming a data-driven company can seem like a daunting task at first, but as you take the first few steps towards it, you will realize that it was a band-aid that you should have pulled off a long time ago, as the gains that are realized from this approach far outweigh the costs. And now with services and tools such as Smart Answers available to do the heavy lifting, there is no reason not to make this the year your company adopts a data-driven decision-making approach.
Add AI & Machine Learning to your business in minutes. Ready to dive in? Start for free today.
- Solutions
Ecommerce
Improve sales by offering personalized recommendations, and more
Social Media & Communication
Get insight on public perception across your social channels
Digital Marketing
Find out which of your digital marketing campaigns are ineffective and why
Enterprise
Generate actionable insight across the enterprise in Sales, HR, Finance & more
Real Estate
Use AI to evaluate property prices in relation to the current market
Restaurants
Find out how to best leverage your restaurant's data to increase revenue
- Company
- Insights
- Contact Us
- Try Smart Answers


© 2026 Smart Answers. All rights reserved.